More Information about:
Link: 1) en.wikipedia.org/wiki/Price_and_Volume_Trend
Link: 2) www.incrediblecharts.com/indicators/price_and_volume_trend.php
Link: 3) http://ta.mql4.com/indicators/volumes/price_trend

Calculation:
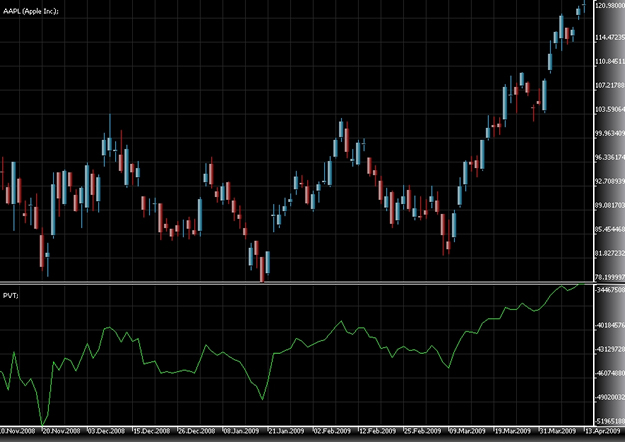
We get PVT by multiplying the current volume by the relative change of the share price and adding the result to the current cumulate value of the indicator.
PVT (i) = ((CLOSE (i) - CLOSE (i - 1)) / CLOSE (i - 1)) * VOLUME (i) + PVT (i - 1)
Where:
CLOSE (i) — the closing price of the current bar;
CLOSE (i - n) — the closing price n bars ago;
VOLUME (i) — the volume of the current bar;
PVT (i) — the current value of PVT indicator;
PVT (i - 1) — the value of PVT indicator on the previous bar.
 Source Code "Price Volume Trend":